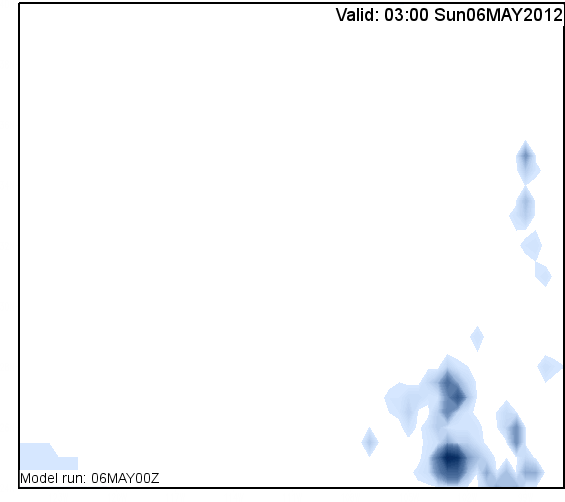
Mouseover the times, click animation controls, or use your cursor keys to navigate.
| Sun 6th | |||||||
|---|---|---|---|---|---|---|---|
| Mon 7th | |||||||
|---|---|---|---|---|---|---|---|
| Tue 8th | |||||||
|---|---|---|---|---|---|---|---|
| Wed 9th | |||||||
|---|---|---|---|---|---|---|---|
| Thu 10th | |||||||
|---|---|---|---|---|---|---|---|
| Fri 11th | |||||||
|---|---|---|---|---|---|---|---|
| Sat 12th | |||||||
|---|---|---|---|---|---|---|---|
| Sun 13th | |||||||
|---|---|---|---|---|---|---|---|
Toggle grid
Toggle locations
Show temperature chart
Show wind chart
Northeast America
Northwest America
Southeast America
America


